Auto-scale History for Dynamic Host Pools
The auto-scale history visualization helps you understand auto-scale behavior and how it impacts your deployment.
The following are important auto-scale history features.
-
Time Range: At the top of the window, select the desired time range to display.
-
Show: At the top of the window, select the desired graph(s) to display.
-
Savings: At the top of the window, you can view auto-scale savings. Select view details to see the savings details.
-
Zoom In: For the Active users graph only, click and drag the mouse over the section of the graph you wish to zoom in on. When you are zoomed in, select Zoom-out to restore the full graph.
-
Gray Background: A gray background on a graph indicates that a scale-in restriction is active during that time period.
-
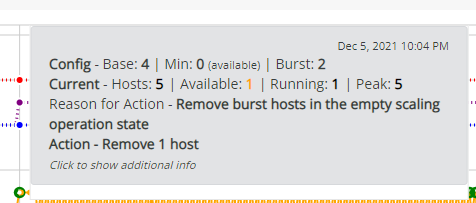
Hover: You can hover over any part of any graph to see its details. For example:
-
Action Points:
-
 Scale Out: This action point indicates that a scale-out event took place. (Red indicates that the scale-out event is costing money.)
 -
 Scale In: This action point indicates that a scale-in event took place. (Green means that the scale-in event is saving money.)
 -
 Auto-Heal: This action point indicates that an auto-heal event took place.
 -
 Azure Issue: This indicates that there was a problem communicating with Azure. If this occurs frequently, please contact Nerdio Manager technical support.
-
-
At the bottom of any graph, select the data set name to toggle on/off the display line associated with that information. For example, select Total user sessions to suppress that line on the graph. Select it again to display it.

-
Depending on which auto-scale trigger has been configured, that determines which graph contains extra values. For example, if the auto-scale trigger is configured based on CPU Usage%, then the CPU Usage% graph contains extra data sets such as Scale In Threshold and Scale Out Threshold.
Note: Regardless of which auto-scale trigger is configured for the host pool, you can configure the host pool to always have the auto-scale process collect CPU, RAM, and Average active sessions data. See Host Pool AVD Configuration for details. Otherwise, the auto-scale process only collects data related to the auto-scale trigger.
To view auto-scale history for a dynamic host pool:
-
Locate the dynamic host pool you want to work with.
-
From the action menu, select Auto-scale > History.
-
Select the desired time range and the specific graphs to display.
-
Active hosts: The Active hosts graph displays Section 1 of the auto-scale configuration (Host Pool Sizing) and host pool activity as recorded by the auto-scale process. This includes the following:
-
Base capacity: This is the number of session host VMs to always be part of this host pool. These session hosts may be stopped or running.
-
Min active capacity: This is the minimum number of running session hosts that are always available.
-
Burst capacity: This is the capacity to burst above the base capacity of session host VMs when there is user demand. The system automatically creates up to this number of new session host VMs above the base capacity when needed.
-
Active hosts: The current number of active session hosts at this point in time.
-
Peak capacity: This the highest number of recorded session hosts for this time period.
Notes:
-
Select an action point to see its details in the Related Tasks section at the bottom of the window. In addition, for any task shown in Related Tasks, select Details to view the task's details.
-
Select any point on the graph to see the status of the session hosts in the Hosts Snapshot section at the bottom of the window.
-
-
User sessions: The User sessions graph displays the following information about when users are signing in and signing out. This includes users connected to full desktop sessions or RemoteApps.
-
Total user sessions: The total number user sessions, which includes disconnected sessions.
-
Active user sessions: The total number of active user sessions, which only includes users who are actively connected.
-
-
CPU usage %: The CPU usage% graph displays the Average CPU%.
-
RAM usage %: The RAM usage% graph displays the Average RAM%.
-
Average user sessions: The Average user sessions displays the average number of user sessions per session host.
Note: If CPU usage%, RAM usage%, or Average user sessions is the auto-scale trigger, then additional scale-out and scale-in data sets are displayed on the graph.
-
Savings (graph): The Savings graph displays compute and storage savings.
Note: As session hosts are started or created, the savings goes down due to increased compute and storage resources. As session hosts are shut down, removed, or disk types converted, the savings go up.
-